Chrome DevTools Integration from a Technical Perspective
An in-depth overview of how some of the most useful Chrome DevTools features came to be in NativeScript.
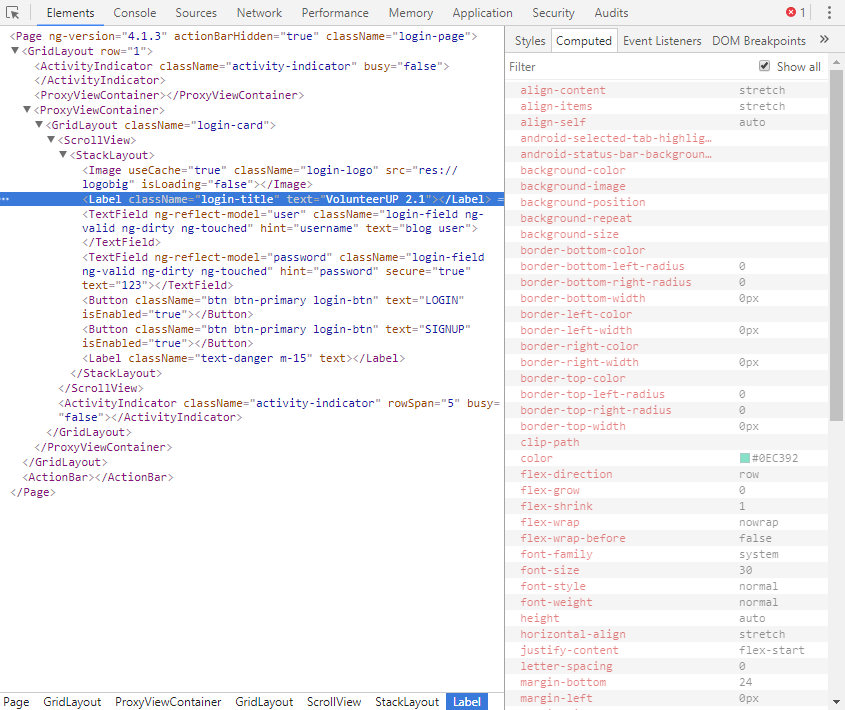
As you may have already heard, last week NativeScript 3.1 was released, and one of its many notable features is a new addition to the arsenal of debugging tools for NativeScript that Chrome’s Developer Tools originally offers to Web developers - the Elements panel. It shows the effective view tree, the page’s current views, as well as their attributes and computed styles.
What do NativeScript and Chrome’s Developer Tools have in common
Aren’t Chrome DevTools only used by Web developers to debug their rendered pages, live-edit them to see immediate results, etc.? Wrong, and right at the same time. Since NativeScript targets mainly Web developers by allowing them to reuse their skillsets, and work with tools they are familiar with, we strive to streamline the development process, and bring it as close as possible to the real deal.

To achieve that we started implementing the Chrome DevTools protocol incrementally in the NativeScript runtimes. NativeScript 2.5 was the first version to feature DevTools support, and ever since we’ve been dedicated to expanding the debugging opportunities NativeScript has to offer. None of it happens seamlessly and effortlessly, so I am here today to share some technical details about the challenges we faced along the way.

How does the underlying protocol work?
To start off, I’d like to mention that Chromium, Chrome, Node.js, NativeScript, and many other existing projects currently use the protocol. It allows for tools to instrument, inspect, debug, and profile applications where the protocol is implemented. Instrumentation is divided into several domains (DOM, Debugger, Network etc.).
A complete list of domains as defined by the DevTools protocol can be found on the Chrome DevTools Protocol Viewer page. Some complex Chrome DevTools features require that several domain agents are implemented. For example, to completely support all features in the ‘Elements’ panel, the embedder would need to implement the specification of several domains, namely - DOM, DOM Debugger, CSS, Overlay.
Communicating through commands and events
Each domain defines a number of commands it supports and the events it generates. Both commands and events are serialized JSON objects of a fixed structure. Applications are debugged by establishing a socket connection with the Chrome DevTools frontend client, using the raw messages as they are described in the domain documentation.
Here is what the DOM.getDocument command, responsible for retrieving the view tree, looks like:
DOM.getDocument(): out ‘root’ of type Node
Type Node: {
nodeId: number
parentId: number
nodeType: number
nodeName: string
children: array [ Node]
attributes: array [ string ]
}
It is then the embedder’s responsibility, when the command comes from the DevTools, to build an object of type `Node` and return it. There are also domain events which can be triggered at certain times or under certain conditions during application execution. And while commands come in from the DevTools frontend – when buttons are clicked, tabs opened, or when the WebSocket connection to the frontend established, events are called from the application, whenever and wherever the embedder considers appropriate, depending on application logic, and domain. Incoming commands can affect the state of the application, or request a result. Events are outgoing messages, that happen on certain application states. A domain dispatcher takes care of handling the communication to and from the DevTools frontend.
Dispatchers this, dispatchers that? What are they?
Domain dispatchers are classes based off the protocol specification for each Domain. They define what is a valid method or command, what isn’t, and the available functionalities. A DevTools Domain whose Dispatcher is not registered when the DevTools connect to the application will not send commands, and should not try to send event messages to the Frontend.
As I mentioned earlier – Domains Dispatchers are also responsible for receiving incoming messages from the Frontend client and mapping them to the specific Domain command implementations. Remember DOM.getDocument? Its implementation in the application would consist of code that fetches the visual tree, extracts the relevant information such as node name, node id, attributes, child nodes, etc., and constructs a Node object that is then returned.

Beside the marshalling magic that makes all the JavaScript you write run on the mobile platforms, the runtimes also integrate with Inspectors (V8Inspector in Android; WebKit WebInspector in iOS) which manage the registered dispatchers and delegate calls to them.
Implementing DevTools Domains
Both Android’s and iOS’s debug Inspectors are implemented in C++, meaning they interact directly with the runtime APIs. Any information concerning the JavaScript execution context — call stack, breakpoints, paused context, and so forth — is available to the underlying JavaScript VM, and actively used during debug sessions. The V8 Inspector for example comes with a ready-to-use Debugger agent used in Node.js, allowing seamless integration with the JavaScript runtime.
So far so good – what about information about network requests or the application’s computed view tree? How do we make Chrome DevTools aware of those? We simply need to implement the Network and DOM agents! Only, information is scarce, the protocol description sometimes either wasn’t enough, or was too vague, and few people have embedded agents beyond those for node.js-like apps in the past, and fewer have even documented it. But, what better source to borrow ideas from, than the Chromium project itself! Reading the source, and debugging the Chrome DevTools’ frontend helped me understand the workflow, the order of calling of commands, expected parameters, etc.
Did you know that, when building a Node object to describe the view tree structure in Chrome DevTools, the document (or root) node is of ‘nodeType’ 9, while every other child element is of ‘nodeType’ 1? Yeah, me neither, turns out that, unless you’ve read the ‘WHATWG’ (Web Hypertext Application Technology Working Group) DOM specification, you’d be in the dark for a while.
Implementation details!
Let’s hop into some implementation details after all this ramble.
As previously mentioned - the NativeScript runtimes alone don’t have any direct way of knowing the current effective view tree, then how can it report network request statistics and the DOM tree structure?

One word - Callbacks!
The runtimes expose global functions that any implementer of the predefined DevTools interface will call. Let’s look at the `Network.requestWillBeSent` event for example – a message needs to be sent to the DevTools Frontend when a page is about to send HTTP request, that will create a pending entry in the list of requests inside the Network panel. In order to populate the list, plugins that deal with HTTP requests, and want to integrate with DevTools, need to build a Request object, whose interface is predefined and provided, and then simply call `global.__inspector.requestWillBeSent(myHttpRequest)`. The runtimes will then handle the callback accordingly, and send the serialized object to the Chrome DevTools Frontend accordingly.

This is in fact how the cross-platform modules’ (`tns-core-modules` package) http module is implemented - it wraps the global callbacks in a TypeScript interface for consistency across the code, constructs a Request object, and invokes the callback. The following illustration shows the workflow of the DevTools, and how starting a network request makes it show up in the Network tab:

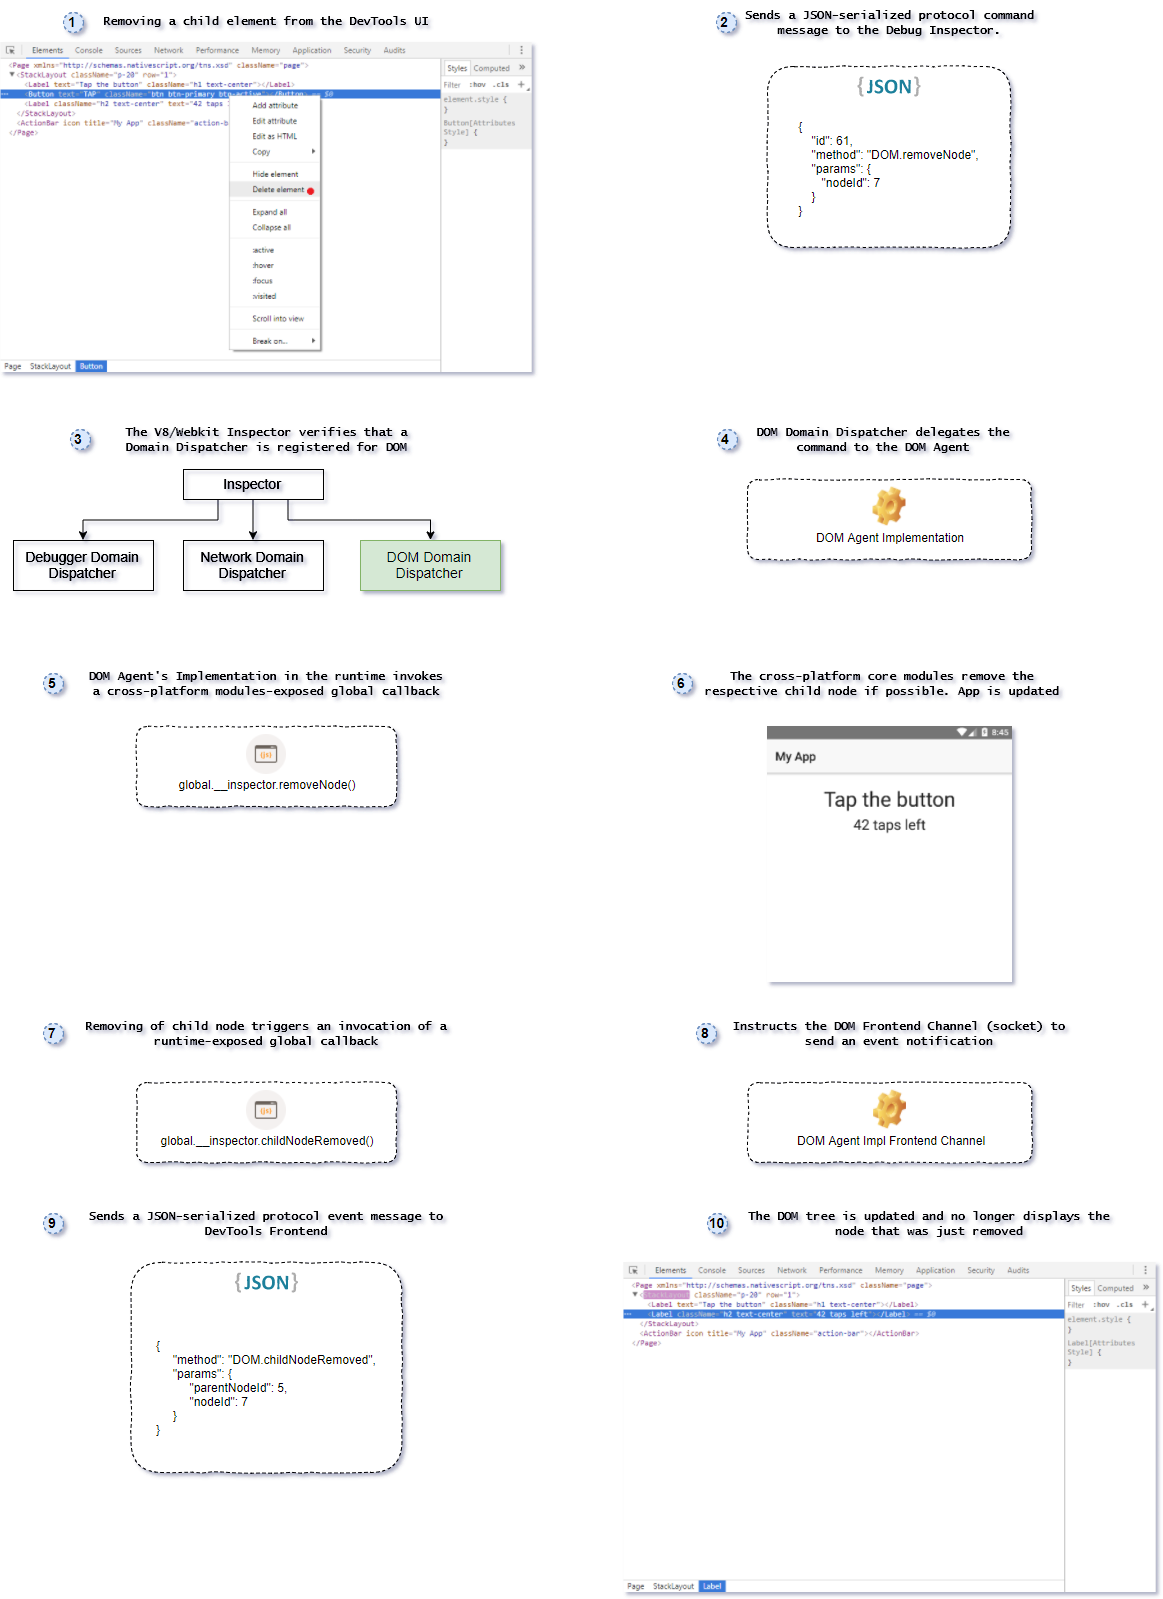
Similarly, when changes to the NativeScript cross-platform views (inheritors of the View class) occur, global callbacks will be invoked, thus informing the Chrome DevTools Frontend to update with the new information, for example when view children are appended, or removed from another view. Analogically, changing a view’s attribute, or trying to remove a view from within the DevTools Frontend will make the DOM Dispatcher in the runtime execute a command, where the embedder – in this case – we, should make the according changes to the underlying view structure to reflect the new state of the view tree in the Elements panel. In that case the runtime should call to functions exposed by the cross-platform modules where the modifications are handled. And this is how the DevTools <-> runtime <-> core modules workflow of the above can be illustrated (Click the image to enlarge):
And now you know - the Chrome DevTools feed off information that is already readily available at runtime. The DevTools communicate through a socket connection with the abstraction over DevTools domain on the other end. The rest is just a matter of implementation details.
What is next?

Now that Elements panel support is out of the door for Android, you can look forward to using that feature for iOS applications pretty soon. Expect polishing and improvements of features that are already supported. As always, we will appreciate any feedback about what we do - feel free to share if you have any issues using the debugger, or possible feature requests!


