Tracing NativeScript Applications
The trace module in NativeScript provides a powerful and flexible set of functions to help you discover what's happening under-the-covers with your application. It's like the Konami Code for debugging the issues you may have. In this blog post, we explore the trace module and its capabilities to help you build robust NativeScript apps.
Tracing is the process of logging diagnostic information about your application at runtime. It is an incredibly useful form of debugging to developers because it can reveal a great of information about your application's internal workings. This holds especially true for the non-visual parts of an application like network and file I/O. Tracing gives developers the ability to observe an application at runtime in order to identify issues.
But First, a Brief Word about the Console Module
Before we dive into tracing, let's briefly examine the console module since it's used extensively by the tracing infrastructure of NativeScript.
The console (or terminal) isn't anything new. We've been targeting it for decades:
Despite the evolution in user interfaces, the console serves a vital role in helping developers debug code.
In NativeScript, console module provides functions for logging diagnostic output to the terminal window. Most of the time, developers will use the console module to log messages via console.log():
console.log("Hello, NativeScript!");
Here's the output that's generated:
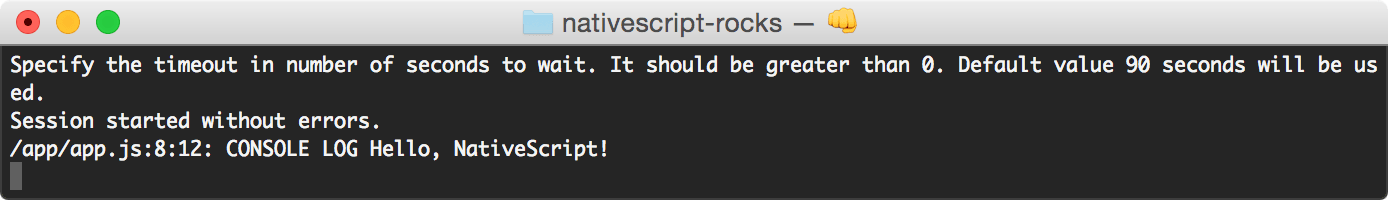
Notice how I don't have to refence the console module itself. That's because it's part of the global scope, making it accessible anywhere inside a NativeScript application.
It's also worth mentioning that the console module has a bunch of helpful functions that you can use when tracing your NativeScript applications:
console.time()andconsole.timeEnd()provides a duration which is useful for tracing operations that are time-sensitive (i.e. performance)console.trace()prints the current stack trace to the console; useful for providing context when tracingconsole.dump()prints the state of an object (currently, Android only)
As you start to use the tracing infrastructure of NativeScript, I'd strong urge you to consider using these functions in your applications.
Getting Started with Tracing
The trace module of NativeScript can be used to log information from your own application and the modules it uses. With NativeScript, the core, device functionality, data, user interface, and WHATWG polyfill modules all incorporate some level of tracing that can be observed.
By default, tracing is disabled; it must be explicitly enabled through its enable() method:
var trace = require("trace");
trace.enable(); // tracing enabled -- let's party!
It's worth noting that you can also disable tracing through its disable() method.
trace.disable(); // tracing disabled -- party pooper!
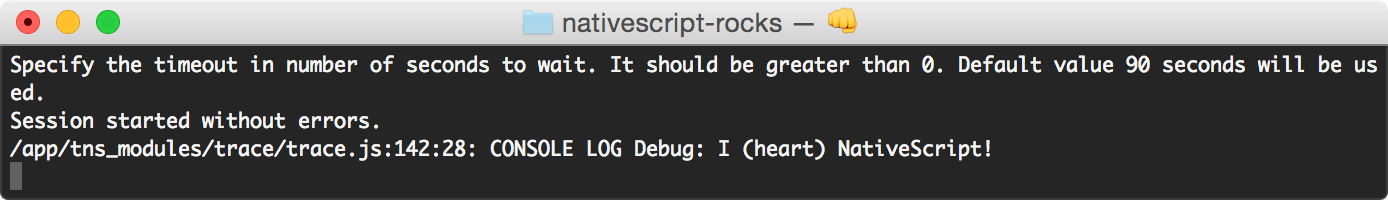
Once tracing is enabled, trace messages will be output by any code or module that invokes trace.write():
trace.write("I (heart) NativeScript!", trace.categories.Debug);
Having this line of code (above) in my application generates the following output to the console:
The trace.write() method takes three (3) parameters:
- message (object): this can be anything for providing diagnostic information
- category (string): a comma-delimited list of categories for filtering trace messages (more on this later)
- type (number): an optional parameter to denote the type of trace message being output (log, info, warn, error)
In the example provided (above), I've provided a string for the trace message but I could have provided a more detailed object for more context.
All trace messages produced by calls to trace.write() are written through a collection of TraceWriter objects. The purpose of these objects is to write trace messages to a particular output (i.e. file). The trace module maintains a collection of TraceWriter objects to which it will direct trace messages. By default, a ConsoleWriter is added to this collection when tracing is initialized. This writer will emit all trace messages through the console module. There are a set of functions you can use to control this collection of TraceWriter objects:
trace.addWriter()adds aTraceWriterobjects to the collection of trace writerstrace.removeWriter()removes aTraceWriterobject from the collection of trace writerstrace.clearWriters()removes allTraceWriterobjects from the collection of trace writers
Currently, NativeScript has one TraceWriter object; the ConsoleWriter. However, nothing prevents you from writing your own.
The trace module provides the ability to filter its output through the setCategories() method. This will force the collection of TraceWriter objects to only output write statements that match the list of categories you provide. The method argument is a comma-delimited string of categories which is used to determine if and when to generate output through the TraceWriter objects. The trace module (itself) defines the following list of pre-defined categories:
- Animation: trace messages for animation configuration and events
- VisualTreeEvents: trace messages for events when modifications are made to the visual tree (Android only)
- Layout: trace messages for layout configuration and events (i.e. calculating layout measurements)
- Style: trace messages for style configuration and events (i.e. calculating and applying styles)
- ViewHierarchy: trace messages for events when views are modified
- NativeLifecycle: trace messages for events when modifying native frames (Android only)
- Debug: trace messages for debugging purposes; used by the web-view, image-cache, and tab-view modules
- Navigation: trace messages for navigation events
- Test: trace messages for tests executed during a test run
- Binding: trace messages for binding events
- Error: trace messages for runtime error events (i.e. missing font file)
- All: trace messages for every category
These categories (above) are used by various modules so it's a good idea to use them as well during configuration.
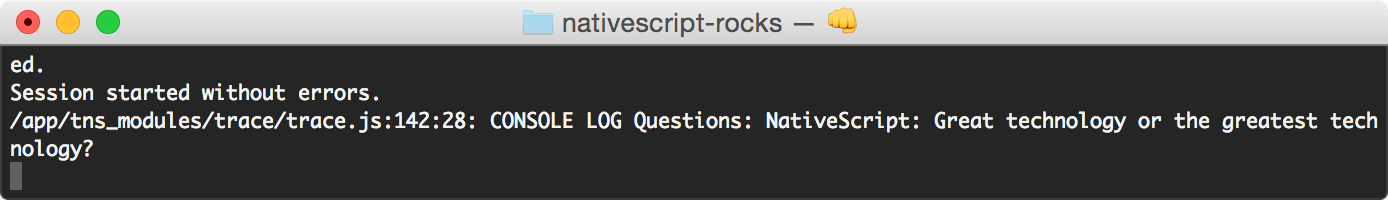
It's important to mention that you don't have to use the predefined categories (listed above); you can define your own. To do this, simply define your category and make sure to apply it consistently when establishing your trace message filter and calls to trace.write() like so:
trace.setCategories("Questions");
trace.write("NativeScript: Great technology or the greatest technology?", "Questions");
Applying this code snippet (above) results in the following being output to the console:
You also can append categories to the existing collection via the trace.addCategories() method. Alternatively, use the trace.categories.concat() method to build a collection of categories that you're interested in:
// add the binding category to the existing list of trace messages
trace.addCategories(trace.categories.Binding);
// filter out all trace messages except those that are animation and debug categories
trace.setCategories(trace.categories.concat(trace.categories.Animation, trace.categories.Debug));
If you want to build a better understanding of how NativeScript works, enable tracing with the trace.categories.All category specified. When you do this, you'll see a lot of trace messages emitted to the console:
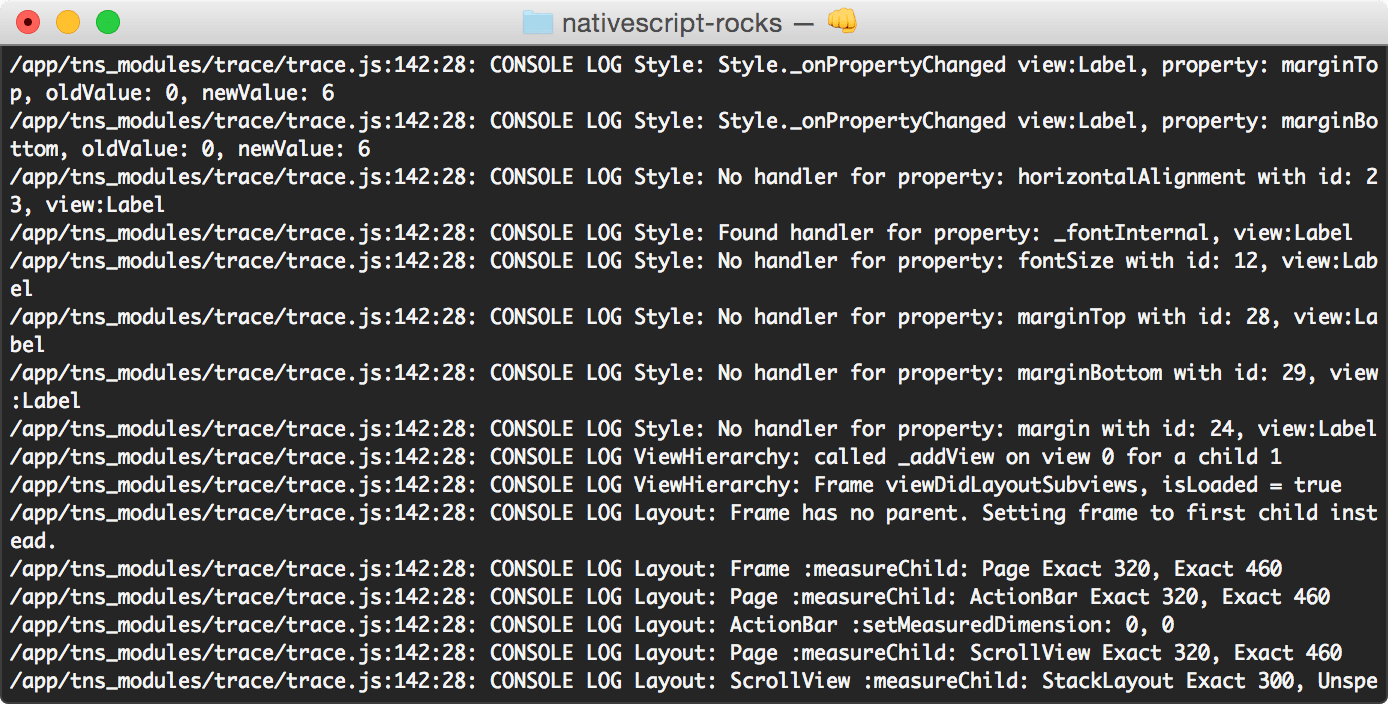
It's like watching and understanding how sausage is made -- in a good way.

Writing a Custom TraceWriter
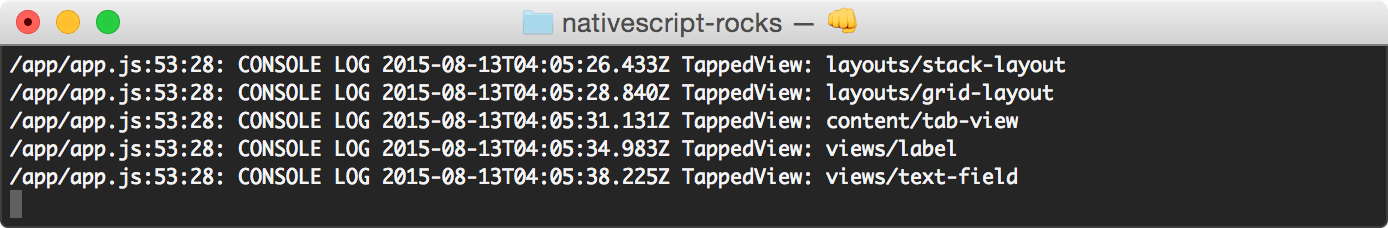
Previously, I stated that you can write a custom TraceWriter. You may wish to do this to route trace messages to a particular output other than the console. Or, you may wish to modify the output itself. Let's assume I'd like to add a timestamp at the beginning of all trace messages. Doing this would give me a time delta that I could use between trace messages. (Note: You'd likely use the timer module to do this, but let's go with it for now.) I'll start by defining a custom TraceWriter called TimestampConsoleWriter:
var TimestampConsoleWriter = (function () {
function TimestampConsoleWriter() { }
TimestampConsoleWriter.prototype.write = function (message, category, type) {
if (!console) return;
var msgType = types.isUndefined(type) ? trace.messageType.log : type;
var traceMessage = new Date().toISOString() + " " + category + ": " + message;
switch (msgType) {
case trace.messageType.log:
console.log(traceMessage);
break;
case trace.messageType.info:
console.info(traceMessage);
break;
case trace.messageType.warn:
console.warn(traceMessage);
break;
case trace.messageType.error:
console.error(traceMessage);
break;
}
};
return TimestampConsoleWriter;
})();
Since I'm using the console module, I'll clear my collection of TraceWriter objects to remove the ConsoleWriter from my collection. Otherwise, I'll get a more than one trace message output to the console for each invocation of trace.write(). I'll then add the TimestampConsoleWriter to the collection of TraceWriter objects:
trace.clearWriters();
trace.addWriter(new TimestampConsoleWriter());
The result of this change is the following output being displayed in the console:
As you can see, the trace module is powerful because you can override its default behavior and incorporate changes through custom categories and TraceWriter objects.
Trace Events and Event Listeners
The trace module also supports a mechanism of tracing your NativeScript application at runtime through event notifications. This is a powerful form of tracing because allows you to broadcast trace events to a collection of subscribers that implement the EventListener interface. event listeners can leverage TraceWriter objects to generate trace messages or they can process the information conveyed in event notifications and perform a different action entirely.
Here's the boilerplate code for a event listener:
var Listener = (function () {
function Listener(filter) {
this.filter = filter;
}
Listener.prototype.on = function (object, name, data) {
// validate parameters and do something for trace.notifyEvent()
};
return Listener;
})();
The on() method is where a event listener will perform work in response to receiving an event notification, which is propagated through calls to trace.notifyEvent() (more on this shortly). The filter property is optional but should included because it provides the trace module control over which event listeners to notify. Just like the output from TraceWriter objects, a event listener will not be notified via trace.notifyEvent() unless tracing is enabled.
Once you've defined a event listener, the next step is to add it to the collection of event listeners in the trace module through trace.addEventListener():
var listener = new Listener("NativeScript Rocks!!11!");
trace.addEventListener(listener);
In the code (above), I've created a new event listener that will receive event notifications with the name, "NativeScript Rocks!!11!". In addition to adding event listeners, I can also remove them through trace.removeEventLister().
Event listeners respond to event notifications that are triggered through calls to trace.notifyEvent():
var data = { /* ... */ };
trace.notifyEvent(this, "NativeScript Rocks!!11!", data);
The trace.notifyEvent() method takes three (3) parameters:
- object (object): the object instance that raised the event
- name (string): the name of the raised event
- data (object): an optional parameter that passes the data associated with the event
When calls are made to trace.notifyEvent(), all event listeners that are subscribed with a matching name/filter are notified and can perform work such as logging to the console.
Wrapping Up
Having a better understanding of how your NativeScript applications work under-the-covers is key to building robust applications that users will love. The tracing module provides a number of powerful mechanisms that you can use to debug problems or validate assumptions. If nothing else, simply enabling it with will better your understanding of how key concepts to NativeScript (such as binding or styling) work.